Get Nosy

Office_Space_Meme
Many years ago when I was a team lead in a Finance IT shop I got into the habit of walking around to check on my clients. I popped into Joe’s office and he was doing something odd.

“Morning Phillip”
I notice his screen is flickering in an odd way
“Hi Joe, Whatcha doin’ there?”
“I’m doing my monthly report to the VP”
“I don’t think I’ve seen anything like this, how does it work?”
“Oh this? I run a report on the mainframe and then use this screen scraping tool to pull the data off the report and put it in a spreadsheet.”

“So how long does that take to run?”
“The screen scraping will run about 30 minutes if it doesn’t get tripped up, but then I have to reformat the data and bring data in from another report and do some VLOOKUPS and a little more cleanup, summarizing and formatting”
“Seems like a lot of work, how long does the whole process take?”
“About three days. Two if I run into no problems and I have no distractions”
“And you do this every month”
“Yep, pretty cool huh?”
“What if I could just give you the data in a spreadsheet? Would that speed things up?”
“You can do that?”, he asked incredulously.
“Absolutely”.

This exchange is what initiated my first data warehouse (using SQL Server 6.5) and I learned some valuable lessons beyond the technical experience I gained. Not only did I make Joe’s life a lot easier, but I discovered that he was dropping about $2 million on average out of his report due to quirks in his process. So not only was he spending too much time on this task, he was also reporting inaccurate data to our vice president. When I solved Joe’s problem, I had the realization that there were probably other coworkers who could use my help who had a similar lack of access to relevant and accurate data in a form they could use.

Joe was the first coworker I encountered like this, but I have found a Joe in every place I’ve worked for any length of time. People in the business, especially in operational roles, will suffer in silence for years believing that the solution they cobbled together is as good as it gets. If you don’t walk out among your coworkers, how can you know what you can do to make positive impacts within your organization? And without regularly interacting with them, how can they know when to ask you for help?

The proliferation of “spreadmarts” and “artisanal spreadsheets”* is a symptom of IT not being responsive to the business. Many IT shops have worked hard to erect processes and barriers between the developer and the business. You need to break down or step around these barriers, for the good of the business because you can’t respond to the business if you are sheltered from it.

Start by walking around departments you generally don’t frequent. Smile. Look for telltale signs of manual data gathering like stacks of reports and highlighters. Another great place to look is in your SSRS execution log. If you see a report that brings back thousands of rows of data and is run regularly, odds are the data is being exported to excel and is being manually married up with other reports via cut and paste and VLOOKUP.

You may find some scary creations. Do not be critical, this is someone’s baby. Sure it’s an ugly baby but someone worked hard to build it and they did the best they could with the tools and knowledge they had available. Just tell them it’s a clever or interesting solution and ask if they would like their design to be automated.

Joe was quite proud of his solution, but it had become tedious, time consuming and sadly, inaccurate. He would rather not spend 3 days each month creating the same report. By showing interest and asking about his process I was able to save him a lot of time and the company a lot of money.

Remember…

WALK AROUND, BE NOSY, BE NICE, BUILD RELATIONSHIPS

*Tip of the hat to Dory Owen for coining the term artisanal spreadsheets

twitterrssby feather
twitterredditpinterestlinkedinmailby feather

Changing Data Sources in Power Query with Parameters

If you use Power Query with different SQL Server environments on a regular basis then you probably have run into the problem of changing your server and database names in your queries after you have developed them. A typical scenario is consuming data in a development environment and then changing your solution to pull data from production. This can be a time consuming, irritating and error prone task. Especially if you have many queries to change. Wouldn’t you rather have a table of data sources you can just edit?

Using the M query language and a parameter table in Excel you can define your environments and then change them on the fly when you are ready to move to another environment. This solution basically has three steps.

  1. Create a Parameter Table in Excel
  2. Copy the M language code below to a query and edit it
  3. Enable Fast Combine

For this example I am using AdventureworksDW and ContosoRetailDW databases on my local instances of SQL Server. First you must define a table in Excel named DatabaseParameters with the following columns at a minimum.

PQ_QueryName
DatabaseName
SchemaName
TableName
ServerName

You could add a comments column or additional columns if you wish.

I’m going to use the DimDate table from the 2014 instance and the DimAccount and Fact Finance Tables from the 2012 instance.

Create an Excel table with these columns at a minimum

Create an Excel table with these columns at a minimum

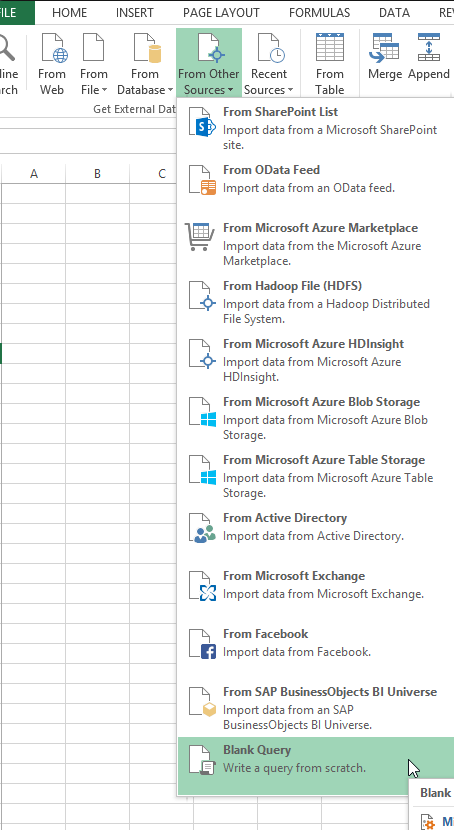
Now I need to create a query that will read the information from this table and fetch the data. In the Power Query ribbon select “Blank Query” from the “From Other Sources” drop down list.

Select "Blank Query" in "From Other Sources" dropdown

Select “Blank Query” in “From Other Sources” dropdown

In the Query editor go to the “View” ribbon and select “Advanced Editor”. Replace the stubbed out code with the following code.


// This Query will use any SQL Server and database defined in a table named DatabaseParameters
// You must have the following Columns in the Table
// PQ_QueryName
// ServerName
// DatabaseName
// TableName --This can also be a view
// SchemaName - often dbo

// This is handy for switching between development and production servers
// without changing your query definition.
// Phillip Labry Oct 2014

let

// Set The Query you want to use here
QueryName = "Test1",

// pull in the parameter table from the current workbook
DB_Parameters = Excel.CurrentWorkbook(){[Name="DatabaseParameters"]}[Content],

// Find the index of the Query you are looking for. You can have many query definitions in the table
Index = List.PositionOf(DB_Parameters[PQ_QueryName],QueryName),

// Grab the Values and put them in variables
ServerName = DB_Parameters{Index}[ServerName],
DatabaseName = DB_Parameters{Index}[DatabaseName],
TableName = DB_Parameters{Index}[TableName],
SchemaName = DB_Parameters{Index}[SchemaName],

// Set your Database Source and Table and go
Source = Sql.Database(ServerName, DatabaseName),
Table = Source{[Schema=SchemaName,Item=TableName]}[Data]
in
Table

// end query

Be sure to change the QueryName variable initialization from “Test1” to the corresponding value in the PQ_QueryName column of the table you want to retrieve. Save the query and at this point you will probably run into an error from the formula firewall about being unable to directly access a data source.

May_not_directly_access_a_data_source

To get around this error you need to enable fast combine.

Enable Fast Combine

Enable Fast Combine. Very important detail!

Once that’s done you can refresh your query and the data will load into Excel.

You should now be able to switch instances and even tables. Keep in mind that each time you switch data sources Excel will ask you about security. Use the appropriate security settings for your environment. I’m going to switch my Dates query from AdventureWorksDW to ContosoRetailDW. I simply change the value in the table and refresh my Dates query.

Multiple_instances

At this point you can load the data into a PowerPivot Data model or straight into Excel.

I’m certain this method could be used to pull data from data sources other than SQL Server but I have not had a need to do that yet. You could probably add source type as a variable and modify the code so that you could switch between Oracle and SQL or other data sources.

If using this technique for a power Pivot Data model I recommend using these queries as a reference. I will write another blog post on the utility of referenced queries and link to it here.

You can download a sample excel spreadsheet here.

twitterrssby feather
twitterredditpinterestlinkedinmailby feather